(→Modified code) |
|||
| (2 intermediate revisions by the same user not shown) | |||
| Line 1: | Line 1: | ||
| − | == | + | ==Bug== |
| + | |||
| + | The bug was a sampling rate that was too low. Ts = 0.07s while the frequency of the sinusoid was 13Hz. Therefore the period of the sinusoid is 1/13 = 0.077 s. With the sampling rate being roughly the same as the period it is little wonder that most of the signal was not captured. | ||
| + | |||
| + | ==Modified code== | ||
F0 = 13; | F0 = 13; | ||
| Line 12: | Line 16: | ||
plot(t,x) | plot(t,x) | ||
| + | |||
| + | |||
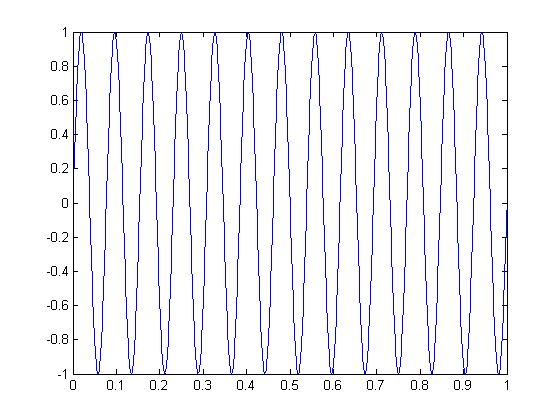
| + | ==Wanted waveform== | ||
| + | [[Image:sinusoid_ECE301Fall2008mboutin.jpg]] | ||
Latest revision as of 09:21, 11 September 2008
Bug
The bug was a sampling rate that was too low. Ts = 0.07s while the frequency of the sinusoid was 13Hz. Therefore the period of the sinusoid is 1/13 = 0.077 s. With the sampling rate being roughly the same as the period it is little wonder that most of the signal was not captured.
Modified code
F0 = 13;
T0 = 1/F0;
Ts = 0.001;
t = 0:Ts:13*T0;
x = real(exp(j*(2*pi*F0*t-pi/2)));
plot(t,x)


