Contents
Singular Value Decomposition
Katherine Wilson
Table of Contents:
- Introduction
- The Basics
- Deeper Understanding
- Example Analysis
- Applications
- References
Introduction:
Singular Value Decomposition has many names, such as factor analysis, empirical orthogonal function analysis, and principal component decomposition. In this discussion, I will refer to it as SVD. To put it simply, Singular Value Decomposition is decomposing a matrix of real numbers into three parts so that it is easier to understand and transform. The three parts that it decomposes to can give more information about the original matrix and the relationships that its rows and columns have to one another. This has many applications in data science when displaying a set of information in a matrix. SVD is mainly used in linear algebra, but it can be understood in its most basic form as early as Calculus or even in Physics classes when breaking down vectors into components and projections. In machine learning, it is essentially taking all of the different variables of a set of objects and reducing the noise to select one variable that can identify the objects from each other. SVD was discovered by many different mathematicians in the late 1800s, namely Eugenio Beltrami and Camille Jordan. It was first used to analyze the different aspects of a person that impact their intelligence, where intelligence would be the matrix to decompose and investigate the different parts to find what is most important. Now, SVD has countless real-world applications with analyzing data in statistics, sociology, atmospheric science, and machines.
The Basics:
Before we get into what SVD really means, it is important to understand some basic concepts. Firstly, SVD deals with matrices, which are a collection of values put into rows and columns. Matrices can be described by the number of rows (n) and columns (m) that they have in the form n x m, which is important to understand when performing operations on them. Matrices can be added, subtracted, multiplied, and divided (or multiplied by the inverse) just like functions, but the processes are a little different. For example, to multiply a matrix by another, you must take the dot product of the two. This is when you multiply each value in the row of the first matrix by each value in the column of the second matrix. For example:
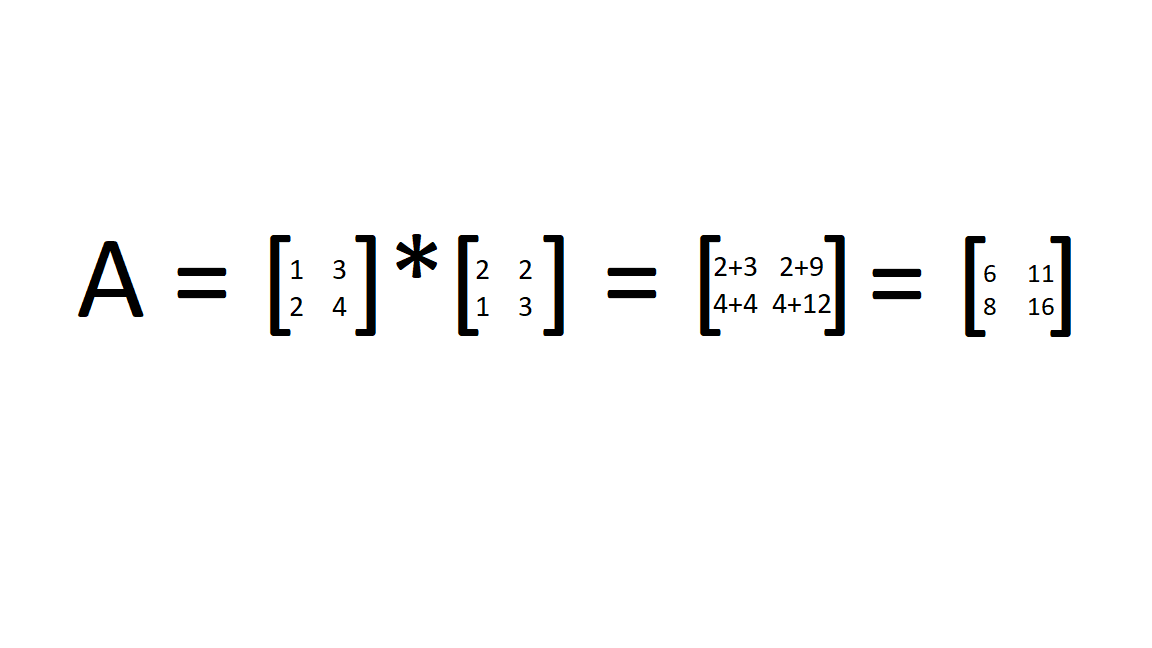
The main equation for SVD is A=USVT, where: “A is an m × n matrix, U is an m × n orthogonal matrix, S is an n × n diagonal matrix, and V is an n × n orthogonal matrix,” [1]. An orthogonal matrix is when the columns and rows are perpendicular unit vectors, and a diagonal matrix contains all values that are zero except in the diagonal line down from the top left to the bottom right. In SVD, the term "singular value" represents the values in the S matrix, and the highest value is always in the top left. U holds the left singular vectors and V the right singular vectors.
Additionally, in the equation, the ^T stands for the “transpose” of the matrix which basically flips the original matrix. For example:
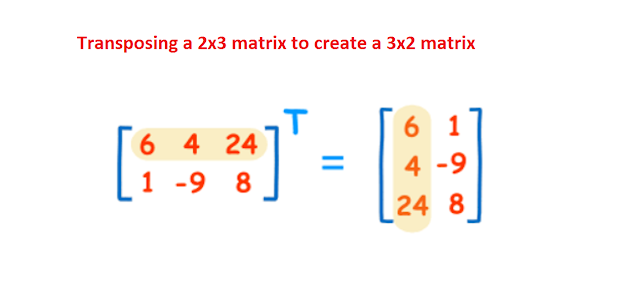 Source
We know that UTU and VTV both give the identity matrix because U and V are orthogonal by definition. The identity matrix is a matrix where the diagonal from the top left to the bottom right have entries of 1, and all other entries are 0.
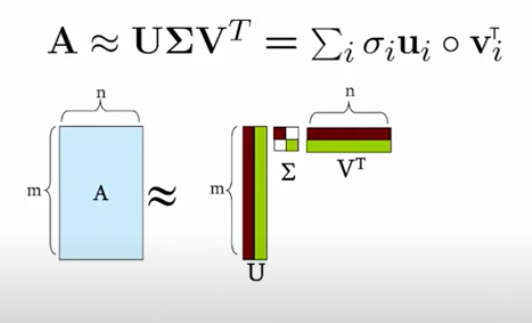
Visually, this is what the decomposition of matrix A looks like: [7]
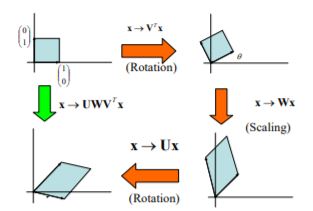
We can also look at a geometric interpretation of the equation for SVD to see what each component does to the original matrix.
The diagonal matrix S (or Win the picture) is the component that can increase or decrease the size of the matrix A. Each number in the diagonal matrix corresponds to an axis, so in a two-dimensional system, the top-left value scales along the x-axis, and the bottom right value scales along the y-axis. If one of the numbers is zero in the diagonal, then the system is linear.
Deeper Understanding:
To dive deeper into what SVD does mathematically, one must understand eigenvalues and eigenvectors. Essentially, an eigenvalue is a scalar quantity that is used to linearly transform a vector or matrix. Eigenvectors are the vectors that are being scaled by the eigenvalue and are basically just stretched or shortened versions of the original vector that are used to understand linear transformations. This is seen often in linear algebra and can be very important for engineering and physics to understand how objects behave.
For further understanding of what eigenvalues truly are, see these references:
- https://medium.com/fintechexplained/what-are-eigenvalues-and-eigenvectors-a-must-know-concept-for-machine-learning-80d0fd330e47
- https://lpsa.swarthmore.edu/MtrxVibe/EigMat/MatrixEigen.html
- https://math.mit.edu/~gs/linearalgebra/ila0601.pdf
So, if we want to truly calculate the SVD, we need to used eigenvectors to find V and U from our given A. We know that the columns of V come from the eigenvectors ATA and the columns of U come from the eigenvectors of AAT. S indicates the sum of these matrices, where the values come from square-rooting the eigenvalues of V and U and go down in order from highest to lowest along the diagonal matrix for S. The website Singular Value Decomposition (SVD) tutorial has a clear example on using eigenvectors and eigenvalues to find U, V, and S for a real matrix A, as well as this example.
Example Analysis:
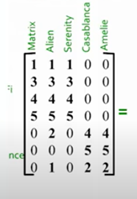
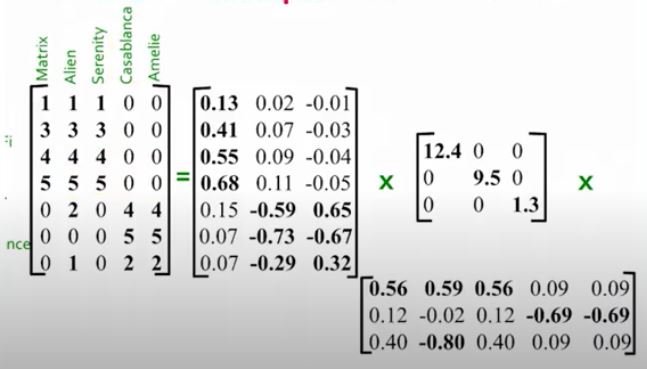
To gain a better understanding of how we can use SVD, let’s look at an example from the video about Singular Value Decomposition from Stanford University. In the example, there is a data set of 7 people and 5 different movies that they watched. Each person rated each movie, and the matrix arranges this data to show who liked which movie. From the movie options, we can see that there were two main genres of movies watched- Romance and Sci-Fi. By taking the SVD to analyze this data, we find this output:
The first matrix U represents how each person responded to the different genres, where the first column represents the Sci-Fi genre and the second relates to the Romance concept. We can see that the first four people responded more strongly to the Sci-Fi genre as there is a higher correlation in that matrix, while the last three more towards Romance. The second diagonal matrix S shows the strength of each genre, or how many people liked it. So, Sci-Fi was the most popular genre because it has a strength of 12.4. The last value (1.3) shows that the third column does not have a large strength on the data, so it does not represent a significant genre and we can ignore it. The last matrix V relates to how strongly each movie corresponds to the two concepts. From this, we can see that “Casablanca” and “Amelie” are more strongly related to romance, while the other three movies are closer to the Sci-Fi category. So, by using SVD we can learn more about each individual person and their preferences for the movies as well as how the movies relate to each genre presented. This can be useful in marketing or recommending movies to users by streaming platforms, such as Netflix or Youtube. Data for each user is collected about the movies watched in the past to categorize what type of content or genre that user like, which is then recommended more often when the user is browsing for things to watch.
Applications:
SVD is often used in data science and computer science to reduce the number of variables being dealt with in very large data sets. As states in the article "Singular Value Decomposition (SVD) Tutorial: Applications, Examples, Exercises", "an SVD with a reduced number of singular values can closely approximate a matrix. This can be used for data compression by storing the truncated forms of U, S, and V in place of A and for variable reduction by replacing A with U" [1]. This also relates to least squares regression, which takes a scatterplot of data points and finds the best-fitting line to represent the data. SVD does this by creating a line that minimizes the distance between all of the data points using the singular values in the diagonal matrix. When the singular value increases, it shows that the strength of the line is greater and more accurately represents the data. SVD can do this in multiple dimensions to have a more accurate understanding of the data and account for more of the variation in the variables.
Additionally, SVD can be used for digital image compression, in which the pixels of an image online are stored in a matrix. A number is assigned for each color on a color scale, and the matrix of values displays the color for each pixel in the image. SVD can be used to reconstruct these images to simplify them and save memory when trying to send images across platforms. For more information on this, see Understanding Singular Value Decomposition and its Application in Data Science.
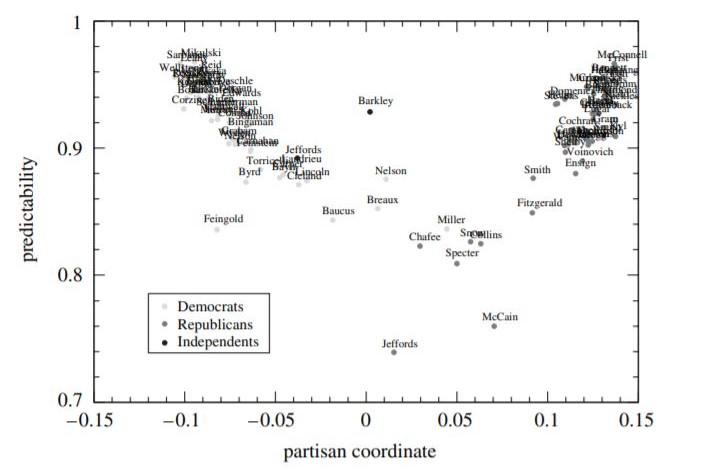
One of the more interesting applications of SVD is with political science. In the paper "The Extraordinary SVD" authors Carla D. Martin and Mason A. Porter detail an analysis of how members of Congress voted on certain bills to determine their political leniency [8]. The study set up a matrix where the rows represented each member of Congress and the columns corresponded to each bill that was voted on in the period of time studied. A vote in favor of the bill corresponded with +1, a vote against the bill is a -1, and a 0 corresponds to a null vote. Much like the example discussed above, SVD broke down this matrix into different components to tell how often each member of Congress voted with their party and how often they voted against. This can help predict how certain congresspeople will vote and show who is more moderate, who is more likely to vote against their party, and who is the most consistent in their votes.
A visual representation of this data is shown above. The "partisan coordinate" is how closely each member of Congress relates to his or her party, with Democrats being a more negative number and Republicans being a more positive number on the x-axis. The y-axis shows how predictable each person is. From this, we can see that the people who are further left or right are more predictable than the more Independent members of Congress, which makes sense because they are more likely to continually vote with their party. It is quite fascinating that political scientists can use complex mathematical ideas to analyze how the government in the United States will rule on certain bills, and it shows that SVD can be applied in any field of study, not just pure mathematics.
References:
- https://blog.statsbot.co/singular-value-decomposition-tutorial-52c695315254
- https://towardsdatascience.com/svd-8c2f72e264f
- https://towardsdatascience.com/understanding-singular-value-decomposition-and-its-application-in-data-science-388a54be95d
- http://web.mit.edu/course/other/be.400/OldFiles/www/SVD/Singular_Value_Decomposition.htm
- https://mathinsight.org/matrix_transpose
- https://www.youtube.com/watch?v=mBcLRGuAFUk
- https://www.youtube.com/watch?v=P5mlg91as1c
- https://people.maths.ox.ac.uk/porterm/papers/s4.pdf
- https://personalpages.manchester.ac.uk/staff/timothy.f.cootes/MathsMethodsNotes/L3_linear_algebra3.pdf

