Transition Diagrams
A Markov chain is a structure that determines the probability of future states using the current state. The specific probabilities calculated by this structure are called transition probabilities, and these probabilities make up a transition matrix, which is a square matrix that represents every possibility in the system.
Example Problem (Used throughout this paper)
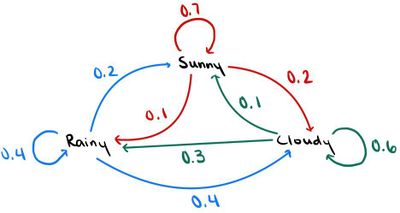
Every day, the weather is either rainy, sunny, or cloudy. If it is rainy today, then for tomorrow’s weather, there is a 40% chance of it being rainy again, a 20% chance of it being sunny, and a 40% chance of it being cloudy. If it is sunny today, then for tomorrow’s weather, there is a 70% chance of it being sunny again, a 10% chance of it being rainy, and a 20% chance of it being cloudy. If it is cloudy today, then for tomorrow’s weather, there is an 60% chance of it being cloudy again, a 30% chance of it being rainy, and a 10% chance of it being sunny. Find the transition matrix of this system.
In this problem, the three possible states are rainy, sunny, and cloudy days. The situation in the example can be modeled like so:
The arrows in the diagram represent the transition probabilities: red for when the current state is sunny, blue for when the current state is rainy, and green for when the current state is cloudy.
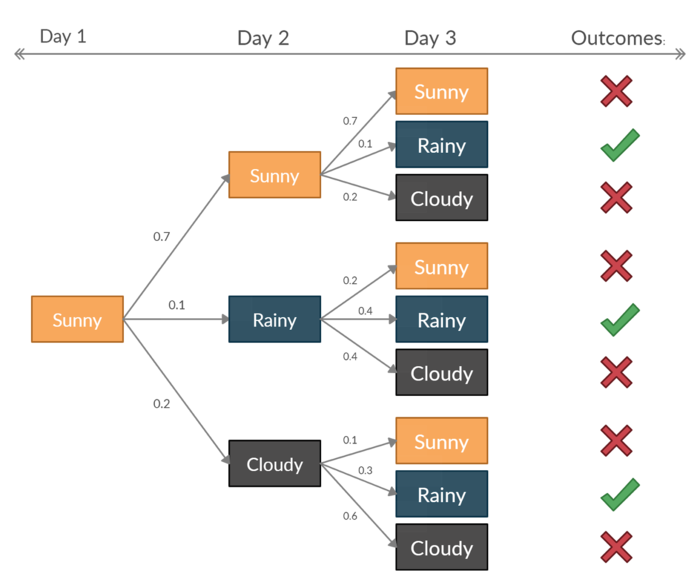
Another way to look at this situation is to use a tree diagram. Now if it is known that the first day is sunny, how can we calculate the probability that the third day will be rainy? The most intuitive way is to use a tree diagram:
It turns out that when the first day is sunny, the probability that third day will be rainy is: $ P = 0.7 \times 0.1 + 0.1 \times 0.4 + 0.2 \times 0.3 = 0.17 $


