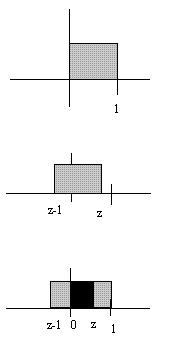
When we were doing the sum of independent x,y there had seemed to be some confusion when we were doing the convolution steps. some people had trouble seeing why the boundaries for 0,z and then z,1 so hopefully this will help out some. For the example where z < 1, we have the following for fx and fz:
The last picture shows that the overlapping part of the two is from 0,z and is therefore the boundaries for our integration when z is less than 1. Our boundaries will then having to again be examined when z > 1 and can be done with the same process as here.
Of course, you can hopefully always solve this (or know what shape to expect at least) with graphical convolution: http://www.jhu.edu/signals/convolve/


