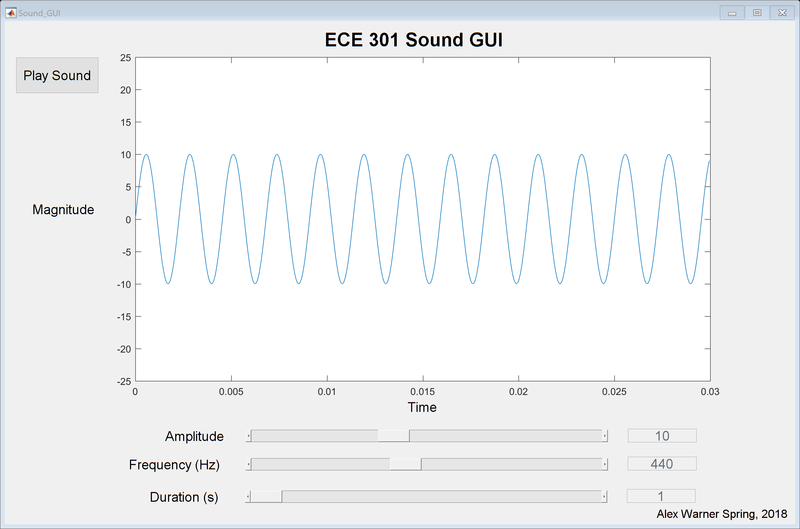
MATLAB SOUND GUI
The following zip contains a .m file and a .fig file. The source code is located within the .m file and can be executed as a regular MATLAB script. Note: the GUI was developed and tested in MATLAB 2016b. It is likely that the code will run in newer versions of MATLAB but not guaranteed. It may or may not run in older versions of MATLAB prior to the 2016b release.
If you simply want to view the GUI application, you can run the .fig file on any machine with MATLAB installed. You can also launch the GUI by loading the .m file into a MATLAB editor and running it as you would any other MATLAB script.
The graph continuously updates as you drag the sliders to adjust the amplitude and frequency of the signal. The GUI defaults to a 440 Hz signal of 1 second direction with an amplitude of 10 when the GUI opens.
It is worth nothing that the time and magnitude axes are fixed so you can note the affect of changing the amplitude and frequency. Adjusting the duration slider will not impact the graph but will result in the generated sound playing for the specified amount of time.


