Contents
[hide]Introduction to Wavelets
Taking Fourier's torch forward...
Background: Why Wavelets?
- I can bet a great deal of money, that as Electrical Engineers, the first person that comes to mind when someone says "SIGNAL PROCESSING" is Fourier.
- Jean Baptiste Joseph Fourier (1768 - 1830) laid a rock-solid foundation for signal analysis, when he claimed that all (continuously differentiable) signals can be represented as the sums of sines and cosines.
- It is hard to imagine the iPod generation without the work this great man did over 2 centuries ago.
- However, the educated world (Electrical Engineers, :D) gradually evolved from their happy continuous perception of life, to the slightly scary, yet extremely promising world of discrete (a.k.a "digital") signals.
- In this world, there is no such thing as continuity (obviously), and signals must be represented as discrete sets of zeros and ones. *These "jumps" would make Fourier very unhappy, because Fourier analysis starts breaking down (leakage, spectrogram uncertainty) when we make abrupt cut-offs and chop signals at will.
- Fundamentally, sines and cosines are infinite length and continuously differentiable, so to represent a jump (zero time or infinite frequency) one would technically need an infinite number of frequencies. Another concept that, albeit well defined on paper, but one that computers detest, is this whole concept of "infinity".
Still, why wavelets?
- This whole concept of breaking a signal down into a summation of simpler or "basis" signals is the cornerstone of Fourier theory.
- However, as mentioned above, the basis sinusoidal signals do not work very well with discontinuities.
- This is where wavelets come in, because they are very good with jumps. (More on this later)
- Another problem we see with Fourier analysis, is the uncomfortable trade-off that exists between time and frequency resolution.
- In other words, if you take a spectrogram of certain data, making your time window finer(increasing temporal resolution), makes your frequency resolution worse. The inverse is also true, i.e. good spectral resolution, causes worse time resolution.
- This is an unhappy decision for signal processors to make, and they often lament, "Why can't I have both?" or "How do I see the tiny variations in frequency while maintaining a reasonably fine resolution in time (and vice versa)"
- Unfortunately, it is impossible using a spectrogram; but wavelets mitigate this problem to a great extent.
- I like how Amara Graps [1] puts it: In wavelet analysis, the scale that we use to look at the data plays a special role; a way of seeing the forest and the trees, so to speak.
Explaining Wavelets
- Now that I've delivered my sales pitch on wavelets, comes the hard part of giving some convincing evidence that they work.
- Having asked even a few grad students, I am convinced that wavelets are a very difficult concept to grasp.
- So before we can use them, let's try to lay a foundation for some of the underlying concepts.
- Basis Functions
- A basis function can be thought of as a building block for functions.
- Just as a set of unit vectors, (1,0) and (0,1) can represent any vector in 2-D space (Eg: [3,5] = 3[1,0] + 5[0,1]), a set of basis functions can be chosen to represent any function.
- A very important condition for basis functions is that their dot product must be zero; in other words, they must be orthogonal.
- It is intuitive to see different combinations of sines and cosines as the basis functions for a Fourier representation.
- In wavelet analysis, the basis functions are more complicated and called "mother wavelets" or simply wavelets.
- Time-Frequency Resolution with Wavelets
- We noticed in Fourier Analysis, that with a longer spectrogram window, we get good resolution in the frequency domain, but poor resolution in the time domain. Vice versa for short windows.
- Here is where wavelets are better. The windows in wavelets vary. To isolate the short time changes (temporal resolution) we choose some short basis functions, and some very long basis functions for detailed spectral information.
- The only catch is, we have to choose our basis functions, unlike in Fourier Analysis, where they were all sines and cosines.
- And the problem with choosing them is, wavelets offer an infinite set of such functions.
Application
- As mentioned before, I am convinced that the theory behind wavelets is complicated, to say the least and beyond the scope of this page.
- I will, however, attempt to present some applications to show that wavelets work!
- But before we explore wavelet analysis, a mathematical background will be useful.
Continuous Time Wavelet Transform
- The continuous time Wavelet Transform is given by:
$ X_w(\tau,s)=\frac{1}{\sqrt{s}} \int_{-\infty}^{\infty} x(t)\psi^{\ast}\left(\frac{t-\tau}{s}\right)\, dt ------(1) $
- Here, the mother wavelet or basis function is given by $ \psi (t) $, and all other analyzing wavelets are derived from translations or scaling of the mother wavelet.
- The parameter $ \tau $ controls the translation of the wavelet, and hence corresponds to the time information in the Wavelet Transform.
- The parameter s, controls the scaling of the wavelet, and hence provides the frequency information in the wavelet transform.
- Also, a close look at the above integral, shows that it is simply a convolution of the mother wavelet and the signal.
Discrete Wavelet Transform
- Now, as many of you might rightly recognize, we may obtain a discrete version of the above transform by simply sampling the time-scale ($ \tau,s $) plane.
- We have to make sure though, as always, that the Nyquist condition is satisfied.
- The resulting series obtained by discretizing the CWT is called the Wavelet Series.
- The computation of the Wavelet Series, while possible may consume significant memory and computation time; and this difficulty lead to the advent of the Discrete Wavelet Transform, similar to the DFT in Fourier Analysis.
- This approach, instead of computing the series for tons of translations and dilations, uses a faster approach: filter banks.
Multi-Resoltion Analysis using Filter Banks
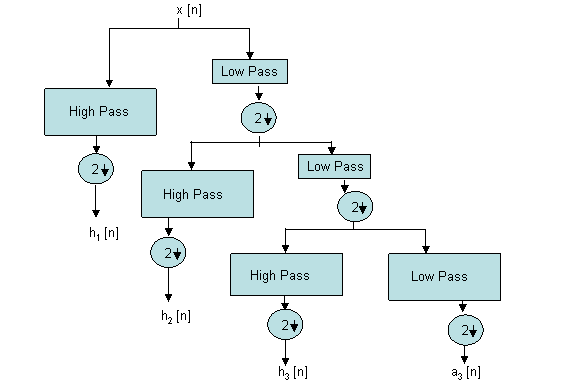
- Wavelet Tree Decomposition (Mallat-tree decomposition) using filter banks is a very useful approach in analyzing signals.
- Consider the block diagram shown above:
- We start by splitting our signal x[n] into it's two constituent frequency bands, i.e., a high-frequency and a low-frequency band.
- If we look at the output of the low pass filter, it is easy to see that the maximum frequency of the signal , say $ \omega $, is now reduced to $ \omega/2 $.
- Therefore, by Nyquist theorem, the sampling rate required to prevent loss of information, is now $ \omega $ instead of $ 2\omega $, required earlier.
- Hence, we can downsample by a factor of 2, safely discarding half the samples of the output image.
- On the other hand, the high pass filtering followed by decimation allows us to isolate high-frequency short-time variations like jumps.
- As, we go further, splitting into more and more levels, the resolution becomes better in both domains.
- The level is usually determined by the length of the signal, as well as it's frequency range.
- So let us see an example of wavelet decomposition.
- We will use a Haar Wavelet in this case, one of the simplest available ones.
- The Haar mother wavelet is given by:
$ \psi(t)=\left\{ \begin{array}{ll} 1 & t\in [0,1/2) \\ -1 & t\in [1/2,1) \\ 0 & t\not\in [0,1) \end{array} \right. $
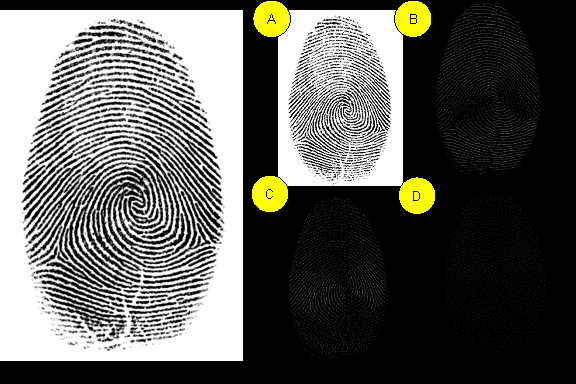
- Since fingerprint image compression is the most significant application of wavelets; the FBI having adopted the JPEG2000 extension (which uses wavelets) as their fingerprint archiving standard; I will present a fingerprint decomposition here.
- The image given below was obtained from [3].
- A is the low pass-filtered coefficient of the image. As expected, most of the black fingerprint regions are preserved as well as the white.
- B,C,D correspond to the high-pass filtered components in the horizontal, vertical and diagonal directions respectively. Here, as expected, only the edges are preserved, while the constant (low frequency) regions are removed.
- An interesting thing to note is that after downsampling, the resultant images contain only half the points of the original image.
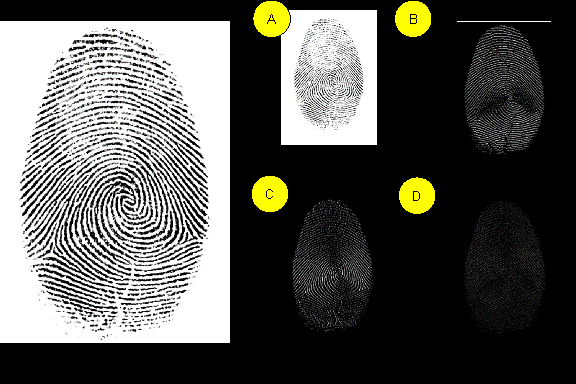
- Another iteration of the algorithm on the low pass filtered output yields the following:
- As you can see, more and more iterations will yield more and more space-frequency information.
- In the first case; A represented the frequency band from 0 to $ \omega/2 $, while B represented the band from $ \omega/2 $ to $ \omega $; where $ \omega $ was the highest frequency in the image.
- In the second case, A now represents 0 to $ \omega/4 $, while B represents $ \omega/4 $ to $ \omega/2 $
- We can keep iterating to get finer and finer frequency resolution, while also downsampling at the same time, to get good space resolution.
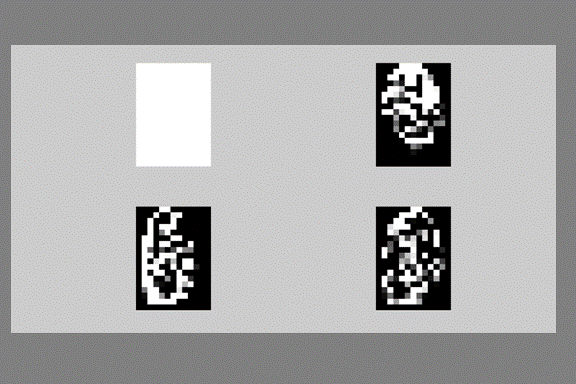
- Here is the image after 3 more levels of the above algorithm. Therefore the image is now 32 times smaller in terms of pixels (we did 2 + 3 levels, hence $ 2^5 $), and 32 times finer in frequency resolution.
Conclusion
- Therefore, we can clearly see how a better space-frequency resolution at various levels is obtained by simply passing the image through a filter bank.
- Although this page presented a basic image analysis technique based on the Haar Wavelet, one of the simplese mother wavelets; there are many many more basis functions, grouped into various families.
- The interested reader may try the references given below for more detailed information.
- The applications of Wavelet Analysis, such as image compression used by the FBI for Fingerprint Storage require more complex steps such as thresholding and entropy coding and are beyond the scope of this page; [5] provides a good reference for those interested.
REFERENCES
- [1] http://www.amara.com/ftpstuff/IEEEwavelet.pdf
- [2] http://www-math.mit.edu/~gs/papers/amsci.pdf
- [3]

- [4] http://www.dtic.upf.edu/~xserra/cursos/TDP/referencies/Park-DWT.pdf
- [5] http://www.owlnet.rice.edu/~elec301/Projects00/wavelet_image_comp/
Last Edit : Dlamba 02:11, 7 December 2009 (UTC)


