Illustration of Bayes Rule
The last couple of essays have provided insight into the Bayesian Decision Theory, showing how conditional probabilities are used to determine the probability of a particular event given that we know the prior probabilities. For this essay, we will be looking at a real world illustration where we can use Bayes Rule to solve a problem.
Example
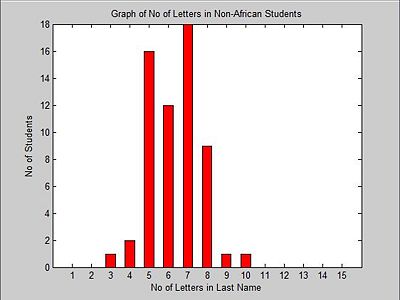
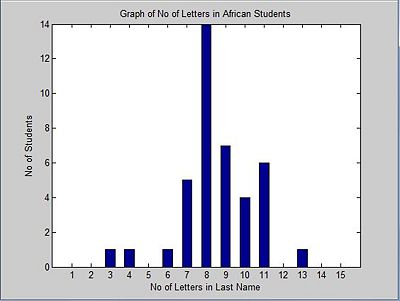
Suppose we have an ECE 302 class with 100 students, 40 African students and 60 Non-African students and we want to distinguish the students with African origin from the rest of class. Since we know that African last names are usually longer than others, we decide to use the number of letters in the last name as the feature to classify the students. We also have the following statistics available to us.
First, the distribution among Non-Africans.
Then the distribution among the Africans.
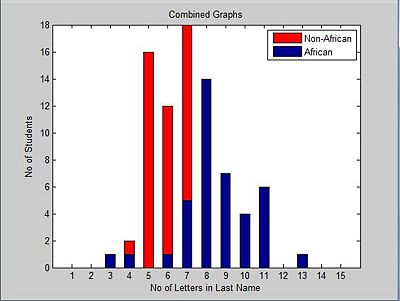
And, both graphs put together.
With all this information, we can use Bayes rule to determine if a student is African or not. Without the information about the length of the last names, the probability of a student being African would always be 0.4, but with the added feature, it becomes easier to determine the origin of the student using Bayes theorem.
Using the equation below
$ P(x_j|y)= \frac{p(y|x_j)p(x_j)}{P(y)} $
and
$ P(y|x)= \frac{P(xy)}{P(x)} $
where:
xj represents the event of an African student
y represents the length of the student's last name
We can find the probability of a student being African or not African given the length of their last name and just plugging into the equations above.
Notes
- Discrete variables are used because its easier to show the differences between the two events, and also easier to calculate probabilities with, however as stated in the previous essay, continuous variables can also be used.
- This only works for situations where there are only two events and one feature classifier.


