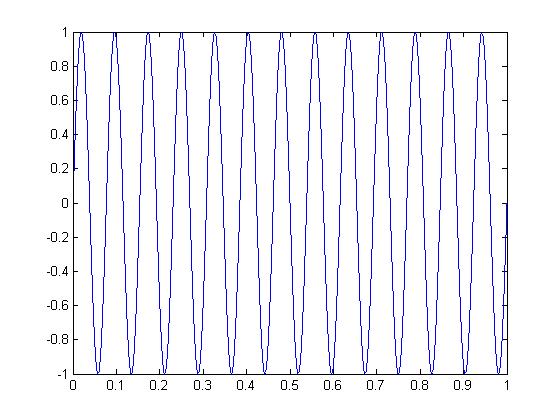
The bug in the matlab code was the value of Ts set equal to 0.07. By dividing the value by 10000, the full function from t values 0 to 1 are displayed in the graph output that were otherwise overlooked.
F0 =13;
T0 =1/F0;
Ts = 0.07/10000;
t  = 0:Ts:13*T0;
x = real(exp(j*(2*pi*F0*t-pi/2)));
plot(t,x);
The results of running the code above yields


