Bug
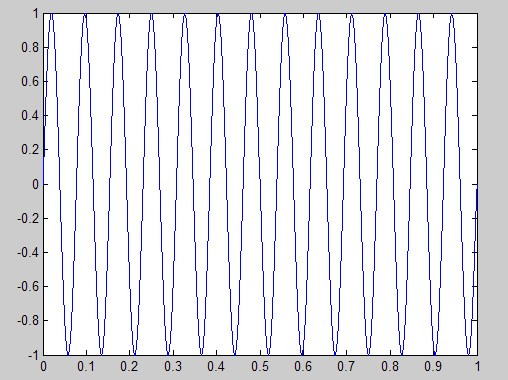
The following graph is generated by Matlab when the original bugged code is run.
Notice that instead of plotting 13 cycles of the 13Hz sinusoidal, it only plots 1 cycle. This leads to the conclusion that the sampling rate is too small. Since the period of the sinusoidal is T0 = 1/13 = 0.076 and Ts = 0.07, we can see that the program only samples once per period, which is not nearly enough. The way to debug this program is to decrease Ts, thereby increasing the sampling rate.
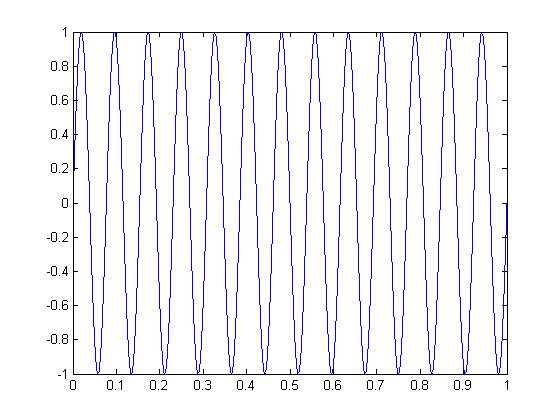
Debugged Code and Result
>> F0 = 13;
>> T0 = 1/F0;
>> Ts = 0.07/10000;
>> t = 0:Ts:13*T0;
>> x = real(exp(j*(2*pi*F0*t-pi/2)));
>> plot(t,x)


