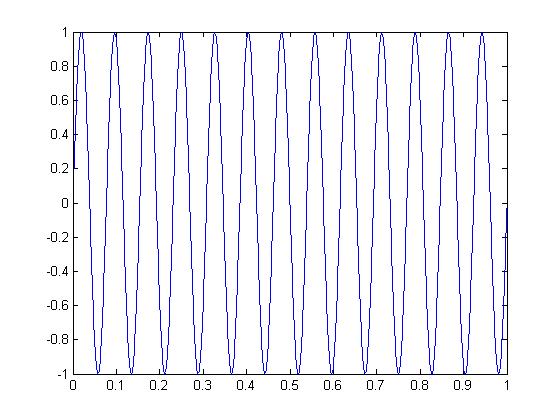
The bug in the MATLAB program is that the sampling frequency here is uite large, as a result it is not getting enough points in order to plot a proper garph.
The code now will become
F0 =13; T0 =1/F0; Ts = 0.0007; t = 0:Ts:13*T0; x = real(exp(j*(2*pi*F0*t-pi/2))); plot(t,x)
When this sampling freuency is reduced then the graph comes out to be


