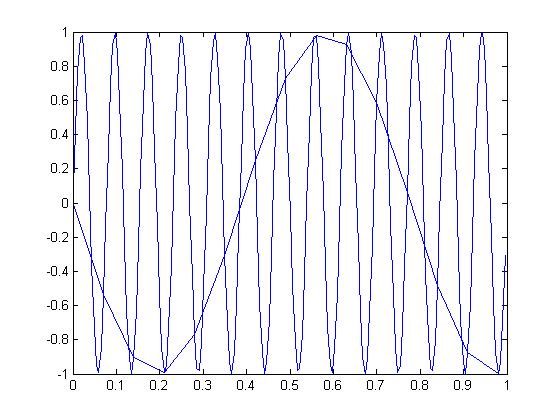
FIND THE BUG
%%%BEFORE THE CODE WAS FIXED%%%
F0=13;
T0=1/F0;
Ts=0.07;
t=0:Ts:13*T0;
x=real(exp(j*(2*pi*F0*t-pi/2)));
plot(t,x)
%%%%AFTER FIXED%%%%%
hold on
F0=13;
T0=1/F0;
Ts=0.07;
t=0:Ts/13:T0*13;
x=real(exp(j*(2*pi*F0*t-pi/2)));
plot(t,x)
It looked like that the sampling points were not enough. It sampled at few points and generated different looking graph in MATLAB


