Problem with MATLAB Code
F0 =13;
T0 =1/F0;
Ts = 0.07;
t  = 0:Ts:13*T0;
x = real(exp(j*(2*pi*F0*t-pi/2)));
plot(t,x)
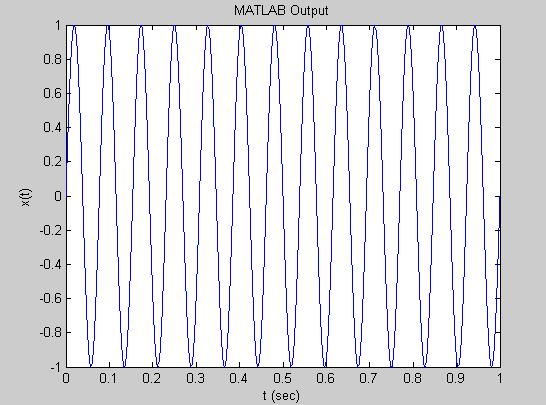
The problem with the above MATLAB code is that the time vector interval Ts = 0.07 sec is too small compared to the period of the signal which is 1/13 $ \approx $ 0.0769 sec. This bug can be fixed by letting Ts = 0.001 sec:
F0 =13;
T0 =1/F0;
Ts = 0.001;
t  = 0:Ts:13*T0;
x = real(exp(j*(2*pi*F0*t-pi/2)));
plot(t,x)
The result is the desired graph of 13 cycles:


