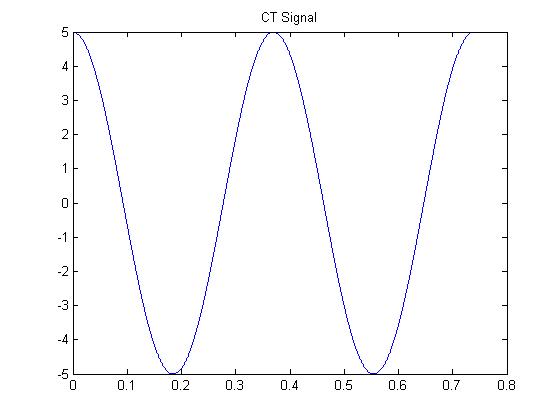
OUTPUT Graphs
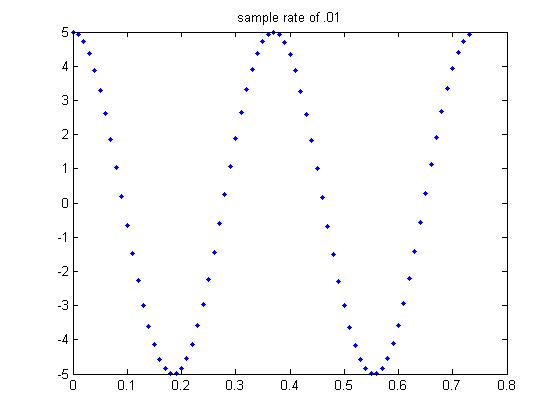
DT function taht is not periodic
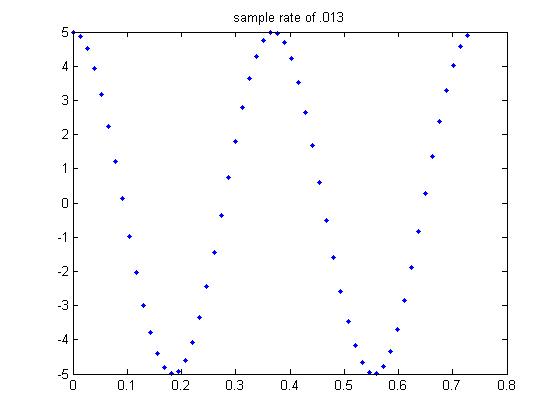
CT function that is not periodic
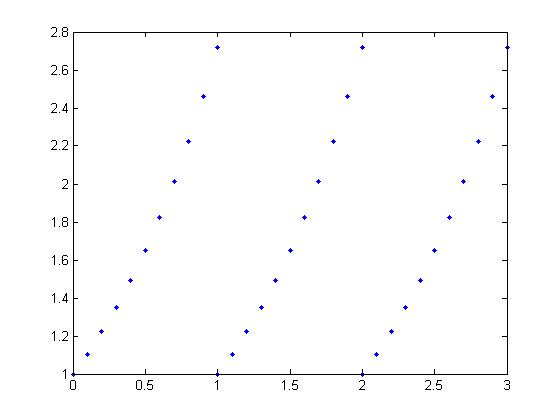
DT function that was made by repeating nonperiodic CT functions
MATLAB CODE
F0 = 17/(2*pi);
T0 = 1/F0;
Ts = .0001;

t = [0:Ts:2*T0]; %time for 2 cycles of wave

x = real(5*exp(j*F0*2*pi*t));

figure(1)
plot(t,x)
title('CT Signal');

% change sampleing rate to be periodic DT signal
t = [0:.01:2*T0];
x = real(5*exp(j*F0*2*pi*t));

figure(2)
plot(t,x, '.');
title('sample rate of .01');

figure(3)
t = [0:.013:2*T0];
x = real(5*exp(j*F0*2*pi*t));
plot(t,x, '.');
title('sample rate of .013');

% non periodic function turned periodic.

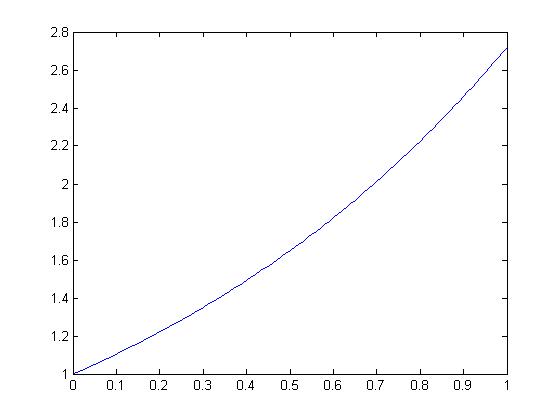
t = [0:.01:1];
x = exp(t);

% non periodic
figure(4)
plot(t,x)

t1 = [0:.1:1];
t2 = [1:.1:2];
t3=[2:.1:3];
t4 =[t1 t2 t3];
x = [exp(t1) exp(t1) exp(t1)];

% repeated non periodic to be periodic
figure(5)
plot(t4,x,'.');

