Contents
What is Assimi?
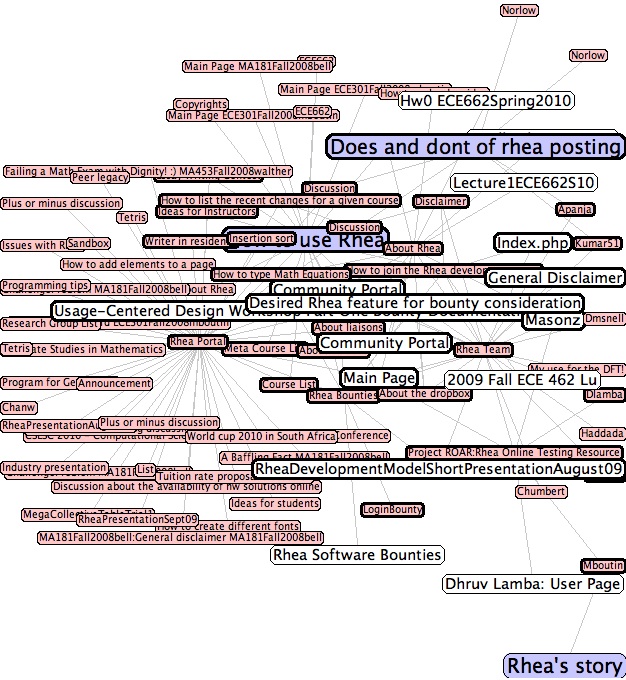
Assimi is a visual text search engine. A canonical view of the search results and their local network is presented on a graphical interface, allowing users to easily browse and identify relevant pages. Several control options are available such as isolating or grouping pages or zooming into various parts of the graph, providing an innovative way to navigate a vast corpus such as Rhea. Here is ascreenshot of what Assimi produces when one searches for the word "rhea". (Of course, in real life it looks much better because the graph is wiggling and you can change its shape with your mouse.)
Who Developed Assimi?
Assimi was developed by Shiv Biddanda with the help of Prof. Niklas Elmqvist and Prof. Mimi Boutin. The visualization engine of Assimi is based on the COE Explorer, a graph visualization tool developed by Prof. Elmqvist with the funding of the Department of Homeland Security through a grant awarded to the VACCINE project (PI Prof. David Ebert). The COE Explorer uses the Prefuse library for the visualizations. The development of ASSIMI was funded in parts by NSF grant CCF-0728989.
How do I use Assimi?
The Search bar on the left of every Rhea page has a field entitled "Assimi Content Search" that accepts input for search queries. The user guide below explains how to use the graphical interface.
Does my computer support Assimi?
To run Assimi, you need to have Java installed on your computer. This page will help you figure out what you need to get Java running on your computer and integrated with your web broswer.
Can I help make Assimi better?
Yes, you can! Please provide feedback on things you would like to see or to report problems you may have with Assimi. Visit the Feedback page to share your input.
How does Assimi work?
Assimi uses a combination of the Sphinx search engine (an extension to MediaWiki) and the Prefuse library to enable visualization of search results.
Assimi GUI User Guide
The GUI consists of four main parts: the main visualization window (center), the query field (bottom), the filter panel (top right), and the upcoming (in the near future) word cloud feature (bottom right). All of these are linked together so that the visualization window shows the network that has been selected from the query field and the filter panel.
To Navigate the Visualization Window:
   * PANNING: left mouse button + drag.
 * ZOOMING: right mouse button + drag (up/down).
To Issue Queries:
   * Type a (partial) search term in the query field (bottom), OR
 * Click on a term in the word cloud (bottom right), OR
 * Click on any node in the visualization window, OR
 * Middle button + drag to lasso a set of nodes to focus on.
The view will animate to focus on whatever subset of the whole network that has been queried. Nodes highlighted in blue are directly matched by the query, those in red are referring URLs which link to this page (also called backlinks) and those in white are outgoing URLs of matched nodes. Right clicking will add that node and its neighbors to the current query. To Clear the Query:
   * Click the "Clear" button to show the whole network, OR
 * Click the "X" button in the search query field to show the whole network.
To Manage Nodes
   * FILTERING: Uncheck the "visible" checkbox for a specific type of node to hide that type of node from view (check the box to show).
 * FIX LAYOUT: Uncheck the "dynamic" checkbox for a specific type of node to fix that type of node in position using a radial layout (check the box to release the nodes to dynamic layout).
Clicking on the "Help" button will toggle a help screen with a short version of these instructions.
Thanks to the PIVOT lab for providing content to the User guide.


