Hello, World!
by Alden Fisher
Introduction
My original intent was to insert an audio file into Matlab and have it print out what I was saying in plain text. This proved to be a challenge for several reasons which I will get to later. What I ended up doing instead was finding the 1st and 2nd formants in the famous sentence "Hello, world."
Challenges
The toughest part of the original plan was in finding a table that mapped out the formants of the 42 phonemes [1] in the English language. This left me with nothing to compare my results to so the computer had no viable data to use. For this reason, I changed the direction of the project to the current goal. Additionally, it was hard, even as a native English speaker, to understand how the IPA is set up [3]. In essence, it was difficult to get through the literature and understand how to accurately map a word, preserving each sound. Charts were found for vowels, however. The phonemes were found for each word [4], but there were no data about their corresponding formants.
Approach
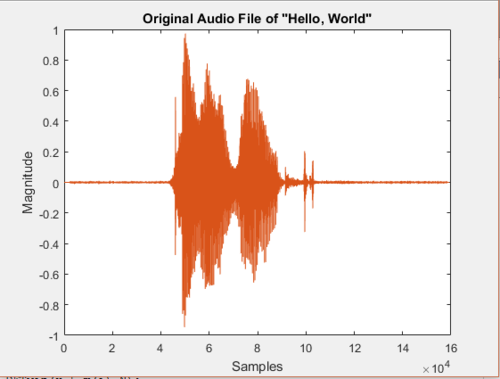
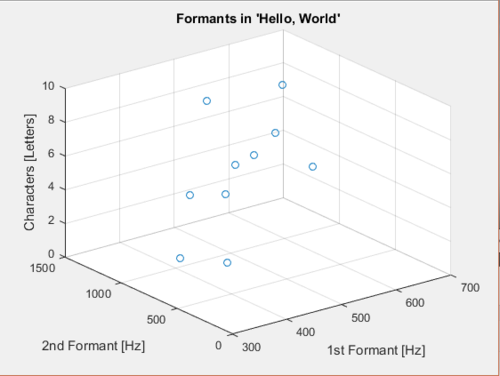
I audio recorded myself in a quiet room saying the phrase "Hello, World." This was recorded on my iPhone which has a sampling rate of 44.1kHz. From there, I converted the file [2] to a '.wav' so that it would be compatible on all computing platforms. Once I had the audio file, I manually trimmed the data to, basically, get rid of any dead time. One assumption I made was that each of the 10 letters lasted the same amount of time. For this reason, I took 10 512-point DFTs using the 'DFTwin' function we created in lab 9a [1]. From there, I extracted the first 2 largest peaks (the formants). Once I had these, I was able to plot them in 3-space with respect to the letters.
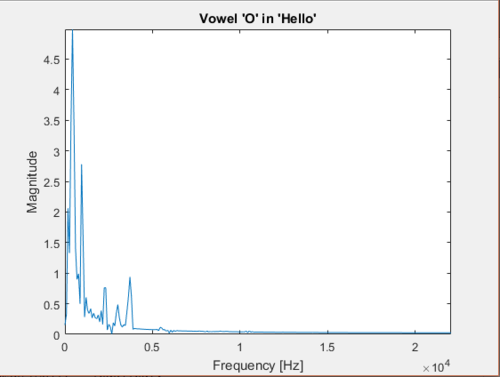
As was shown in figure #3, the 1st and 2nd formants were calculated to be at 517Hz and 1208Hz, respectively. The actual [1] were supposed to be 450Hz and 1050Hz. This shows the error in my assumption about the words being equal in length and significance. Nonetheless, the values are arguably close.
Conclusion
In a strange (and error-prone way), I was able to collect some data about my speech and where exactly my formants lie. From here, I can calculate the 1st and 2nd formants for all 42 phonemes and make my original goal a reality.
[1] Purdue ECE 438, "ECE438 - Laboratory 9: Speech Processing (Week 1)", October 6, 2010, https://engineering.purdue.edu/VISE/ee438L/lab9/pdf/lab9a.pdf.
Lab used for general direction and background information, including the formant chart for vowels
Free online software used to convert the audio file
[3] https://en.wikipedia.org/wiki/International_Phonetic_Alphabet
Background information on how the words are structured and understood
[4] http://phonemicchart.com/transcribe/1000_basic_words.html
Used to get the official phonetic spelling for both words


